Blog: Texas Senate Redistricting: A Statistical Analysis

Nov 15, 2021

Texas Senate Redistricting: A Statistical Analysis


On October 25th, Texas Governor Greg Abbott put pen to paper and signed off on new maps for Texas’ Senate districts. This capped-off the arduous redistricting process which takes place every ten years, meant to account for population shifts measured in the decennial censuses. Barring any judicial orders to redesign the new districts, the new map will take effect for the 2022 primary and general election seasons. So, we decided to dig deep into the numbers and estimate how the newly-drawn lines will affect Texas Senate races in 2022. Spoiler alert: the GOP benefits.


Currently, Republicans control 18 of the 31 seats in the Texas Senate, and Democrats occupy the other 13. Despite the demographic shifts taking place in Texas, the fact remains that it is certainly a conservative-leaning state, and its legislature reflects that. Interestingly, though, Republican candidates often even outperform the intrinsic partisan advantages they’re afforded. Allow me to explain.


The Built-in Conservative Advantage


The chart below shows how much the Republican won (or lost) by in each of the 26 most recent regular Texas Senate races in which both a Republican and a Democrat ran. There were 3 seats in which no Republican ran and 2 seats in which no Democrat ran, but these seats were excluded in order to analyze what happens when Republicans and Democrats face off against one another.


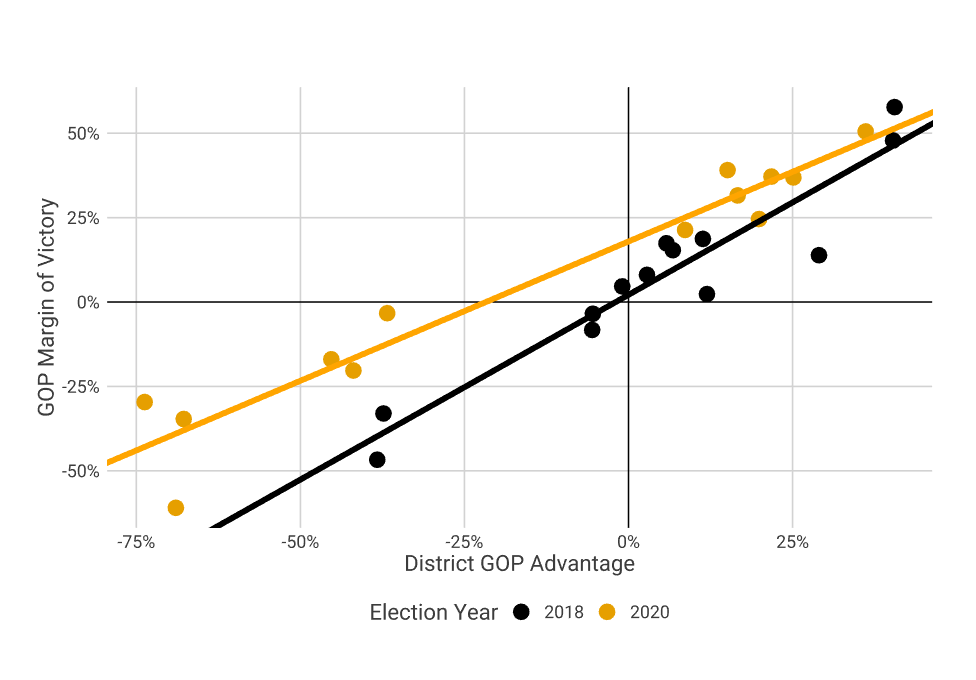
The other variable included in this chart, District GOP Advantage, measures the partisan advantage the GOP enjoys in that district. This is calculated by subtracting the percentage of likely voters in the district who are modeled as Democrats from the percentage of likely voters in the district who are modeled as Republicans. Essentially, a District GOP Advantage of 10% simply means that Republican voters make up 10% more of the district’s electorate than Democratic voters do.


Here’s where things get interesting. When you separate the elections by which year they took place (2018 or 2020) and generate a regression line to fit the data, you notice that the 2018 line (black) has a steeper slope than the 2020 line (orange), but the 2020 line has a higher intercept. The steepness measures how much the District GOP Advantage correlated with the election’s outcome, and the intercept measures the “built-in” advantage (or disadvantage) Republican candidates had that year, regardless of the District GOP Advantage. But why does this matter?


Well, this intercept is one of the most effective and empirical ways to measure a party’s performance in an election year. In 2018, widely dubbed the “Blue Wave” due to Democrats’ impressive national gains in that year’s elections, the GOP Margin of Victory intercept was only 2.1%, meaning that in a district whose likely voters were equally split between Democrats and Republicans, the Republican candidate would be expected to win by an average of 2.1%. In contrast, that number jumped to 17.9% in 2020, a more “typical” election year – at least in terms of partisan turnout. In other words, Republicans had a much better year in 2020.


Direct Effects of Texas Senate Redistricting


But what does all of this have to do with redistricting? Well, the purpose of fitting a regression model to the data was to derive a formula that predicts an election outcome based on the District GOP Advantage. While we don’t yet know what the election outcomes will be in each redistricted seat, we do know the District GOP Advantage for each new district. Thus, we can predict the results of the 2022 Texas Senate elections by plugging in the new District GOP Advantage values into one of the models we generated based on previous election data.


But before we jump into the results of applying this model to predict 2022 outcomes, let’s first examine how each district’s GOP Advantage changed after the redistricting process. The following chart shows which party benefited from redistricting in each district, and by how much.


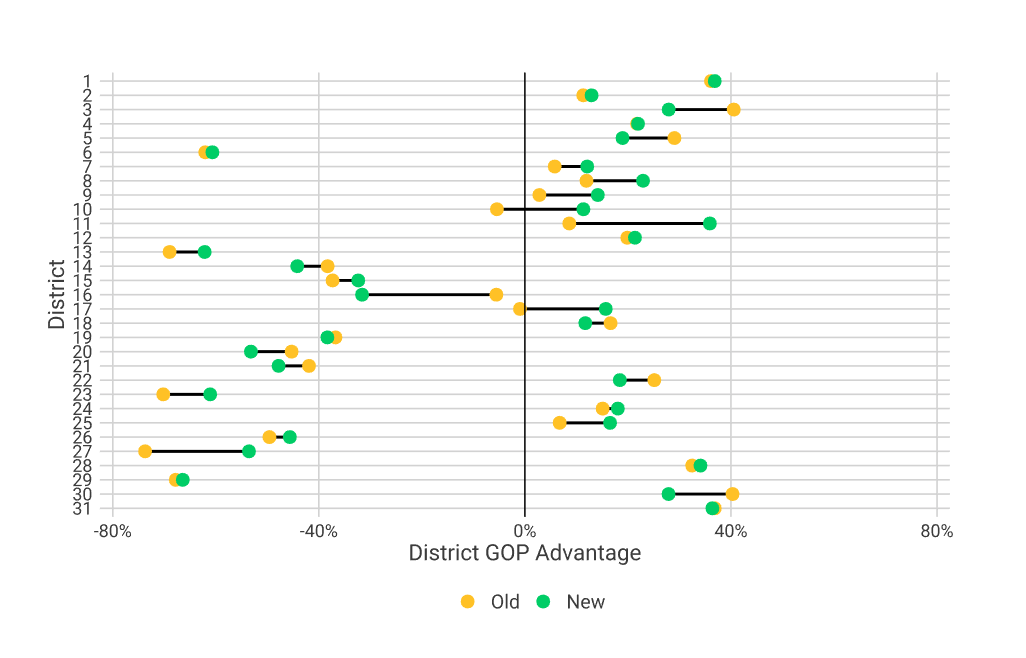
After considering the above chart for a few moments, three main patterns become apparent.


  1. First, you’ll likely notice the right-most quadrant of the chart (>40% District GOP Advantage) is almost entirely empty, while the left-most quadrant (>40% Democratic Advantage) is much more crowded. What this means is that there are many more “packed” Democratic districts (8 old districts, 9 new districts) than “packed” Republican districts (2 old districts, 0 new districts). When Democratic voters are consolidated into districts with an extremely overwhelming Democratic majority, it makes it easier for Republican-leaning districts to form, as the largest chunks of the Democratic base have already been removed from the equation. But wait - this doesn’t necessarily mean Republicans committed any foul play in order to make this happen. Democratic bases are often naturally consolidated in inner cities, while Republican electorates are typically spread out over wider distances, often with Democratic enclaves.

  2. Next, redistricting “reined in” the partisan advantages in many of the most partisan districts. For instance, the three districts with the greatest GOP Advantage lost some of their advantage after redistricting, as did the five districts with the greatest Democratic Advantage. In practicality, this has few implications, as these districts retained a heavy partisan advantage.

  3. Finally, the districts closest to the 0% Advantage line (i.e. the most competitive districts) moved farther to one side or the other. In fact, of the seven Texas Senate districts with a partisan advantage of 10% or less, every single one of them gained a partisan advantage of 10% or more after redistricting. Six of these districts gained a 10% or more Republican advantage, while only one gained a 10% or more Democratic advantage. The below chart isolates these seven districts, showing how almost all of them shifted to the right quite substantially.


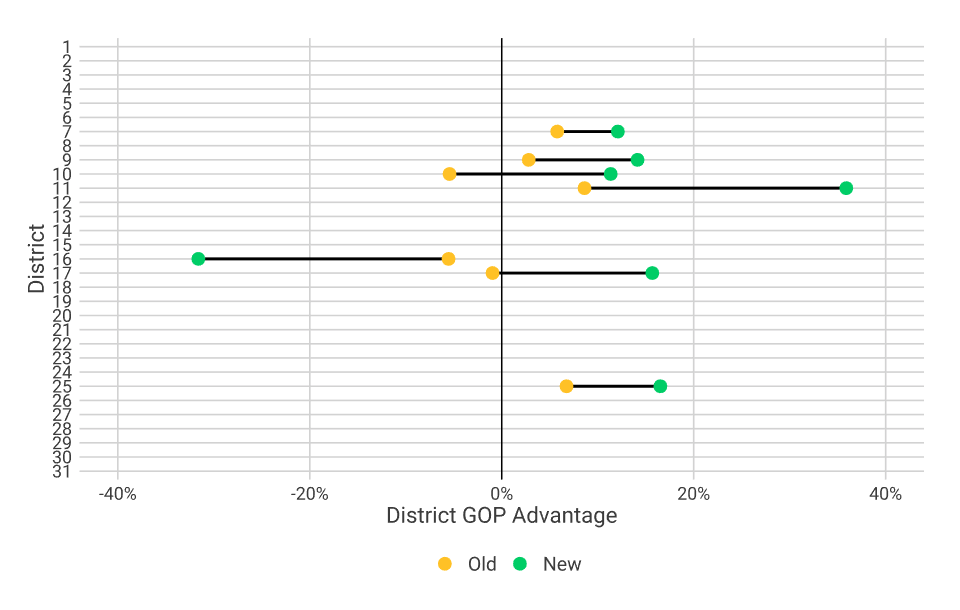
Pay special attention to District 10 in the above graph, which shifted from a 5.4% Democratic Advantage to an 11.4% Republican advantage. Incumbent Senator Beverly Powell (D) would almost certainly lose her seat in the next election cycle, and has now filed a lawsuit alleging that the new district dilutes the minority vote.


But of all the graphs we’ve presented thus far, none exemplifies the direct partisan effects of redistricting quite as succinctly as the one below. Districts with no clear partisan advantage (i.e. those surrounding the 0% Advantage line) got pushed to one side or another, while those with the largest partisan advantages (i.e. those on the fringes) got pushed towards the middle.


Statistical Predictions for the 2022 Texas Senate Elections


Now, it’s time to discuss why redistricting even matters in the first place: elections. In the 2022 election cycle, the new districts will take effect for the very first time. And as discussed earlier, we can use past election data relating the District GOP Advantage to the GOP Margin of Victory to predict future election results.


But that brings us to our next question: should we use the data from 2018 model or the data from 2020? Since most politicos expect Republicans to perform at least as well in 2022 as they did in 2020, we’ll use the 2020 regression model to predict 2022 results. Here’s the formula:


GOP Margin of Victory = (0.82518 x District GOP Advantage) + 17.941%

By plugging in the new District GOP Advantage values, we can predict whether the Republican or Democratic candidate will win in each 2022 Texas Senate race, and by how much. The below chart displays the results of this prediction model.


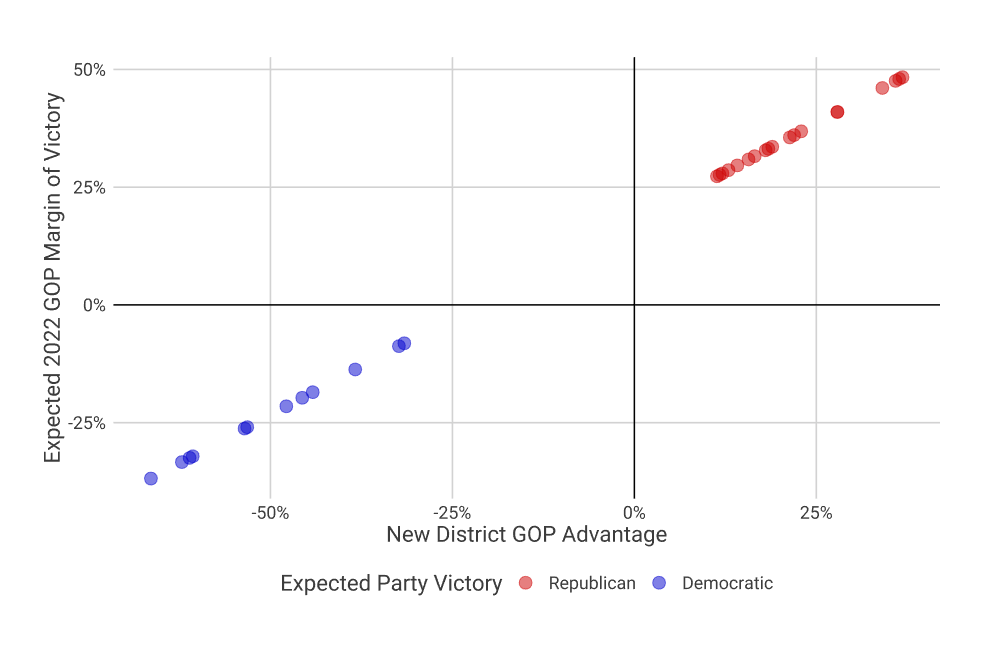
As shown above, the model predicts Republicans to win 19 of the 31 Texas Senate seats in 2022, a 1-seat gain compared to their current 18 seats. However, it should be noted that all 19 of these seats are predicted to be won by a significant margin - in fact, by more than 25%. Democrats, on the other hand, are facing much more of an uphill battle. Exactly half of the seats they’re expected to win in 2022 are predicted to be decided by a margin less than 25%, giving Republicans opportunities to pick up even more seats, especially if they perform even better than expected.


A natural question might be: “Which currently Democratic seat is predicted to flip red in 2022 to give Republicans a 19-12 majority instead of 18-13?” Well, this is where District 10 once again comes into play. We’ve already discussed how Democratic Sen. Beverly Powell is suing over her district’s significant shift to the right, and it turns out that that might be her only hope of remaining in office. Our model predicts that her district will be won by a Republican candidate by a margin of approximately 27.3%, which is music to Republicans’ ears and a worst nightmare for Sen. Powell.


All in all, the Texas Senate redistricting process decreased the number of tossup districts in favor of creating more heavily Republican or Democratic districts. And while a few Democratic incumbents gained a stronger partisan hold on their district (5 of them, to be exact), Republicans were the overwhelming winners of this redistricting process. Despite all the talk of Texas becoming “California-ized” with the massive influx of new residents, don’t expect the Texas Senate to turn blue anytime soon - especially not before another round of redistricting.


25 Apr, 2024
FOR IMMEDIATE RELEASE April 25, 2024 Contact: Victory Insights [email protected] (929) 388-6585 Victory Insights Wins "Best Use of Data Analytics and Machine Learning" at the 2024 Pollie Awards Washington, DC – Last week, the American Association of Political Consultants hosted the 2024 Pollie Awards in Washington, DC. At this event, Victory Insights was awarded 1st place in the "Best Use of Data Analytics and Machine Learning" category. Our firm was honored with this prestigious award as a result of our groundbreaking campaign data management software, called Campaign Dashboard. Throughout the 2023 election cycle, Campaign Dashboard was used in dozens of campaigns to synthesize regular voter data with up-to-date on-the-ground data from polls, web forms, door-to-door campaigning, and more. Additionally, our software provides users with integrated AI chat functionality to pull outreach lists, analyze data, and receive campaign strategy recommendations driven by machine learning. Innovation is at the heart of everything we do. We were founded with the intention of shaking up the political polling industry, and that's exactly what we've done. We look forward to continuing to innovate how data is collected, analyzed, and utilized in the political industry. ###
24 Jul, 2023
General elections are frequently discussed, but rarely understood. Commentary about general election outcomes often resorts to pointing fingers and saying “I told you so,” instead of focusing on available data and objective facts. We believe that the largest contributing factor to this unfortunate phenomenon is the lack of a data-driven model capable of explaining general election outcomes. For this reason, we’ve developed such a model. This model can be expressed in two different ways: (1) qualitatively in a three-layer model for abstract discussion, and (2) formulaically for precise calculations. Let’s start with the qualitative three-layer model. As shown in the diagram below, the base of this model is Voter Registration, followed by Turnout, and finally topped with Support.
24 Jul, 2023
In mid-May of this year, Florida politicos on both sides of the aisle turned their attention towards Duval County, where the race for Jacksonville Mayor was coming down to the wire. Despite the fact that Democrats made up 4.3% more of the registered voter base than Republicans in Jacksonville, Republican turnout exceeded Democratic turnout by 3.2% by the end of Election Day. With turnout numbers tilted in their favor, Republicans were hopeful that their nominee, Daniel Davis, would come out victorious. That didn’t happen. Instead, Democrat Donna Deegan won with 52.1% of the vote, besting Davis’s 47.9%. Despite strong Republican turnout – bolstered by the Florida GOP’s get-out-the-vote efforts – the Republican candidate had lost, and many on the right were left scratching their heads and asking, “What went wrong?” In this article, we’ll be answering that question through the lens of the Victory Formula, a model developed by our team for the purpose of understanding general election outcomes. If you’d like to take a deeper dive into this formula, you can read this article explaining how it works. But for our purposes today, all you need to know is that the formula takes in nine variables (three about voter registration, three about turnout, and three about support for each candidate), and produces the exact margin by which a Republican candidate wins (or loses) a head-to-head general election. Since the election in Jacksonville has already happened, we were lucky enough to have exact final numbers for voter registration and turnout, meaning all that’s left for us to understand is the layer we refer to as “support.” This layer has three simple variables: Republican loyalty, Democratic loyalty, and nonpartisan loyalty. Republican loyalty refers to the percentage of Republican turnout that resulted in votes for the Republican candidate. For instance, if 100 Republicans voted in the election, but only 75 of them voted for the Republican candidate, then Republican loyalty would be 75%. Democratic loyalty refers to the same concept, just on the Democratic side. And finally, nonpartisan loyalty simply refers to the percentage of the nonpartisan/third-party that went to the Republican candidate. None of these variables can be found in the election result data. Instead, we must use the Victory Formula to make inferences about their values, and from there, draw conclusions about why the race ended up the way it did. But there’s an issue: with three unknown variables, there are many different combinations that could result in Deegan’s 4.2-point victory. In fact, these potential “solutions” can be mapped out on a three-dimensional surface:
29 Jun, 2023
Data analysis always helps – even on the School Board It’s not just political polling that benefits from rigorous data analysis. This past week, our firm was tapped to do some impromptu data analysis to check if a Collier County, FL School Board member’s claim was accurate. It turns out, it wasn’t – and we had the receipts to prove it. In November of 2022, Collier County elected an all-new conservative majority to their School Board, and the county’s superintendent “stepped away” from the job not long after. The ensuing process to hire a new superintendent was contentious, but eventually the Board decided on Dr. Leslie Ricciardelli, a longtime Collier County educator, and the next step was to iron out a contract. There were two schools of thought on the matter. One wing of the Board supported Dr. Ricciardelli’s request to be paid $305,000 per year. The other wing wanted to offer a lower salary, as that’s what was advertised in the job posting. At a public School Board meeting, conservative activist Rachael Schaaf questioned whether this $305,000 salary was a responsible use of taxpayer money. In response, School Board member Stephanie Lucarelli – the most outspoken proponent of the salary increase – argued that $305,000 was “in line with other superintendents across the state.” It is this statement that we were tasked with fact-checking. To do so, we collected data on superintendents’ salaries from every county in the state of Florida, as well as each county’s total student enrollment. We plotted this data in the chart below, and with the help of a trusty trendline, we clearly showed that the proposed $305,000 salary was out of line with counties with similar enrollments.
25 May, 2023
The belief has long been held that, in order for a candidate to win an election, they must be popular. After all, it makes sense: who would vote for someone they don’t like? While this age-old belief isn’t entirely false, the reality is far more nuanced, and varies greatly depending on whether we’re talking about primary elections versus general elections, crowded fields versus head-to-head matchups, and small-town races versus big-money slugfests. Let’s work through several different scenarios in order to unpack this. If you’re the only candidate with a sizeable campaign war chest in a race against unsophisticated competitors, then yes, your spending should primarily be aimed at gaining popularity and building Name ID. Your popularity alone will likely be enough for you to sail across the finish line in first place. However, what if it’s a crowded Republican primary in which several candidates are well-funded? Now, things are different. In this scenario, it’s unlikely that any one candidate will win more than 50% of the vote, so you’re no longer seeking a majority – only a plurality. In this case, even if a majority of voters like you, what good does that do? It’s not enough voter voters to like you. They need to like you more than your competitors. Let’s use a real-world example here. In both our Florida and Iowa polls regarding the 2024 Republican presidential primary, more GOP voters had a positive opinion of Ron DeSantis than of Donald Trump. Put simply, DeSantis was more “popular” than Trump. Nevertheless, Trump annihilated DeSantis in head-to-head matchups, winning by 15% in Florida and 19% in Iowa. The moral of the story here is that, in such a situation, it’s not about whether or not people like you, it’s about whether they support you more strongly than they support your opponent. Building such support inherently requires taking risks. If you only make wishy-washy statements designed to appease everyone, and your competitor makes bold statements that strike a chord in the hearts of voters, the voters will choose your competitor over you nine times out of ten. They very well may like you, but they won’t like you enough to vote for you over your competitor. Of course, most elections aren’t crowded primaries between sophisticated and well-funded campaigns. Most are simple, and can be won by hitting base hits, not home runs. Nevertheless, it’s crucial to know the difference, and how this difference affects your strategy. To round out this discussion, let’s refocus our discussion on general elections. Once you’ve made it out of the primary and are now facing a Democrat, the election becomes much more about popularity. General elections are, in most cases, a head-to-head race. Thus, whoever can win over 50% of voters plus one wins the race. Of course, the ease of accomplishing this varies greatly depending on the district. If 70% of likely voters in your district are Republicans, it’s much easier for you to win than in a district where only 35% are Republicans. But regardless of the partisan makeup of your district, the general axiom remains true: the more popular candidate wins. And in many districts, that means winning over nonpartisan and third-party voters, which requires you to conduct targeted outreach and fine-tune your messaging. (Hint: if you’re in a purple district, the “Top Issues” page on your website should shift closer to the center of the political spectrum during the general election.) In summary, although popularity is a key factor in most elections, it’s certainly not the end of the story. In many cases, intensity of support is more important than breadth of support. Your strategy should take into account the makeup of the electorate, your competitors, and the type of election. Best of luck!
24 May, 2023
Every time poll results regarding the 2024 Republican presidential primary are released to the public, the media goes into a frenzy to report on who’s winning, by how much, and in which states. Twitter users speculate endlessly about the implications of the latest numbers and whether Trump or DeSantis has the edge (still many months away from the first votes being cast). In many instances, it’s been our firm releasing these poll results, and despite the widespread coverage they receive, the mainstream media and the general public seem to have missed perhaps the most interesting insight of them all: the Trump-DeSantis divide clearly falls along socioeconomic lines.  We first uncovered this insight in our April poll of likely 2024 GOP primary voters in Florida . The chart below shows the Trump-DeSantis split among lower, middle, and upper class voters.
24 May, 2023
Since Donald Trump announced his bid for the 2024 Republican presidential nomination in November of last year, his endorsements have rolled in in waves. The first flurry of endorsements came right after he announced his candidacy, and the most recent came in the wake of his indictment and subsequent arrest. With dozens of congressional Republicans already endorsing Trump, candidates for public office are justifiably wondering whether they themselves should endorse the former president’s 2024 bid. To help candidates decide whether to endorse Trump in the 2024 Republican presidential primary, we’ve identified four key questions that candidates should consider before making such a pivotal decision: 1. Are you more concerned about winning the primary election or the general election? 2. How popular is Trump in your state? What about in your district? 3. Have your competitors endorsed anyone? 4. Is Trump actually going to win the Republican primary? In the remainder of this blog post, we’ll dive deeper into each of these questions and explain how candidates can use them to make a final determination on whether to issue an endorsement. 1. Are you more concerned about winning the primary election or the general election? Endorsing Donald Trump will likely have two effects: (1) many conservatives will be pleased, and (2) many others will be angered. It’s no secret that Trump is a polarizing figure, so it’s important to consider how the voters you’re courting will respond to your decision. If you’re already the presumptive Republican nominee in a left-leaning district, that means you should be much more concerned about winning the general election than the Republican primary, and therefore should be courting middle-of-the-road voters. Most GOP voters will side with you over a Democrat no matter what, so it’s not as important to appease GOP voters as it is to win the support of independents and moderate Democrats. In this case, it would probably be unwise to endorse Donald Trump, as he’s typically unpopular among non-GOP voters (in most districts). On the other hand, if you’re running in a deep-red district, winning the Republican primary will almost certainly translate to winning the general election. In this case, it’s not particularly important to appease anyone other than GOP primary voters, so endorsing Trump would be far less risky, assuming that Republicans in your district still support the former president. Your own situation will likely fall somewhere between these two extremes, and there are several other factors to consider, which we’ll soon discuss. Nevertheless, it’s extremely important to remember which voters you’re trying to win over when making this crucial decision. 2. How popular is Trump in your state? What about in your district? This question is pretty self-explanatory. You probably shouldn’t endorse Trump if the vast majority of your electorate dislikes him. And, conversely, you probably should endorse him if the vast majority of your electorate does like him. However, it’s not always easy to gauge the true sentiments of your electorate without some real, unbiased, up-to-date data. FiveThirtyEight is a great resource for finding this data via political polls. The 2024 presidential election, and Donald Trump in general, are hot topics, so it’s likely that there’s a recent poll in your state (or maybe even your district) on Trump’s favorability and/or whether he should be the 2024 GOP nominee. If you can’t find sufficient data to make your decision, you can also reach out to our team to commission your own proprietary poll among voters in your district. It's important to not just consider whether Trump is popular or not, but also whether voters support his new presidential bid. For instance, our polling in Florida shows that many DeSantis 2024 supporters still hold Trump in high regard, but just don’t want him to be the nominee. For this reason, it’s crucial to look at all aspects of the issue, and not just simple toplines. 3. Have your competitors endorsed anyone? Your competitors can and should influence your decision of whether or not to make an endorsement, but the calculus here can get tricky. If no one has endorsed a 2024 contender, then it may be safest to stick with the crowd and stay out of it. But, the first to endorse a 2024 candidate could get a boost from supporters of that same candidate. There’s also the confounding factor – although one you should never count on unless you’ve had a definitive conversation about such – that your endorsement of a candidate could result in a reciprocal endorsement from that very same candidate. Even still, there are more factors to consider here. What if, for example, you’re in a ten-way Republican primary where all nine of the other candidates have endorsed Trump? Maybe, purely for strategic purposes, endorsing some other candidate besides Trump could help you differentiate yourself and carve out just enough support to win a plurality of votes. Clearly, the consideration of your competitors’ decisions can be a tricky yet crucial task. 4. Is Trump actually going to win the Republican primary? This is probably the most contentious question of the four because it requires a fair degree of speculation. No one can say with certainty who the 2024 Republican nominee will be, but most politicos would agree that Trump has the best chance right now. Our recent polling in Iowa showed Trump with a 30-point lead over the entire field, and our Florida poll showed Trump beating Ron DeSantis in his own state. If you choose not to endorse anyone (or worse, endorse one of Trump’s competitors), and Trump becomes the nominee anyway, it could put you in a tough spot. Republican voters might question how much of an “America First conservative” you truly are if you refused to endorse the de facto founder of the America First movement when he needed it the most. However, if you endorse Trump and then he fails to secure the Republican nomination, that wouldn’t be a great look for you, either. Clearly, there are many factors to consider before making your decision, and it sure isn’t black and white. Remember to (1) remember which voters you’re courting, (2) consider your electorate’s opinion, (3) account for competitors’ decisions, and (4) think big picture. By asking yourself the four questions outlined above, we hope you will gain more clarity on the important decision of whether to endorse Donald Trump for President. Best of luck!
24 Apr, 2023
FOR IMMEDIATE RELEASE April 24, 2023 Contact: Victory Insights [email protected] (929) 388-6585 Victory Insights Wins "Best Use of New Digital Technology" at 2023 Pollie Awards Palm Springs, CA – Last week, the American Association of Political Consultants hosted the 2023 Pollie Awards, dubbed "The Oscars of Political Advertising," in Palm Springs, California. At this event, Victory Insights was awarded 1st place in the "Best Use of New Digital Technology" category. Our firm was honored with this prestigious award as a result of our groundbreaking analysis software, AnyWeigh. Throughout the 2022 election cycle, AnyWeigh was used in dozens of campaigns to analyze poll results, conduct election simulations, and make informed conclusions about electorates, all within one standalone software program. Innovation is at the heart of everything we do. We were founded with the intention of shaking up the political polling industry, and that's exactly what we've done. We look forward to continuing our cycle of innovation and changing the political polling industry for the better. ###
03 Nov, 2022
FOR IMMEDIATE RELEASE November 2, 2022 Contact: Victory Insights [email protected] (929) 388-6585 Ron DeSantis Projected to Defeat Charlie Crist for Florida Governor Fort Myers, FL – Victory Insights is projecting that incumbent Republican Ron DeSantis will defeat Democratic challenger Charlie Crist in the 2022 race for Florida Governor. Polling gives DeSantis a 13% lead just a week before Election Day, all but guaranteeing a win. Our simulations give DeSantis a 99.99% chance of victory. Expect him to cruise to victory on Tuesday. Victory Insights is one of the nation's premier political polling, outreach, and analysis firms. Our presence, experience, and accuracy - particularly in the state of Florida - is unmatched. ### UPDATE (November 9, 2022): Ron DeSantis has been re-elected as Florida Governor, as predicted by Victory Insights.
23 Aug, 2022
FOR IMMEDIATE RELEASE August 22, 2022 Contact: Victory Insights [email protected] (929) 388-6585 Laurel Lee Projected to Win Republican Primary for Florida's 15th Congressional District Fort Myers, FL – Victory Insights is projecting that Laurel Lee will win the Republican Primary for Florida's 15th Congressional District. The hotly-contested seat is one to watch in November, as many are expecting it to turn red as a result of the post-2020 redistricting process. Polling shows Laurel Lee head and shoulders above her closest competition. Our simulations give Lee a 99.2% chance of victory, all but guaranteeing an Election Day victory. Victory Insights is one of the nation's premier political polling, outreach, and analysis firms. Our presence, experience, and accuracy - particularly in the state of Florida - is unmatched. ### UPDATE (August 24, 2022): Laurel Lee has won the Republican Primary for Florida's 15th Congressional District, as predicted by Victory Insights.
MORE POSTS
Share by: