
Blog: From Blue to Red: Redistricting Analysis in TX SD-10

November 16, 2021

From Blue to Red: Redistricting Analysis in TX SD-10


Last month, the Texas Legislature and Governor Greg Abbott approved new State Senate maps for the next decade, and as our recent analysis revealed, Republicans were the primary benefactor. However, one seat caught our attention more than any other, and that’s Senate District 10. Here’s why.


What Happened in SD-10?


Incumbent Senator Beverly Powell is a Democrat who’s represented Senate District 10 ever since her upset victory of an incumbent Republican in the 2018 “Blue Wave.” But if the new Texas Senate maps take effect, she’ll likely have to find a new gig. As a result of redistricting, her district shifted nearly 17% to the right, flipping from a 5.4% Democratic advantage to an 11.4% Republican advantage. As her 2018 victory was only by a margin of 3.4%, this shift in favor of Republicans would almost certainly prove fatal for her re-election hopes.


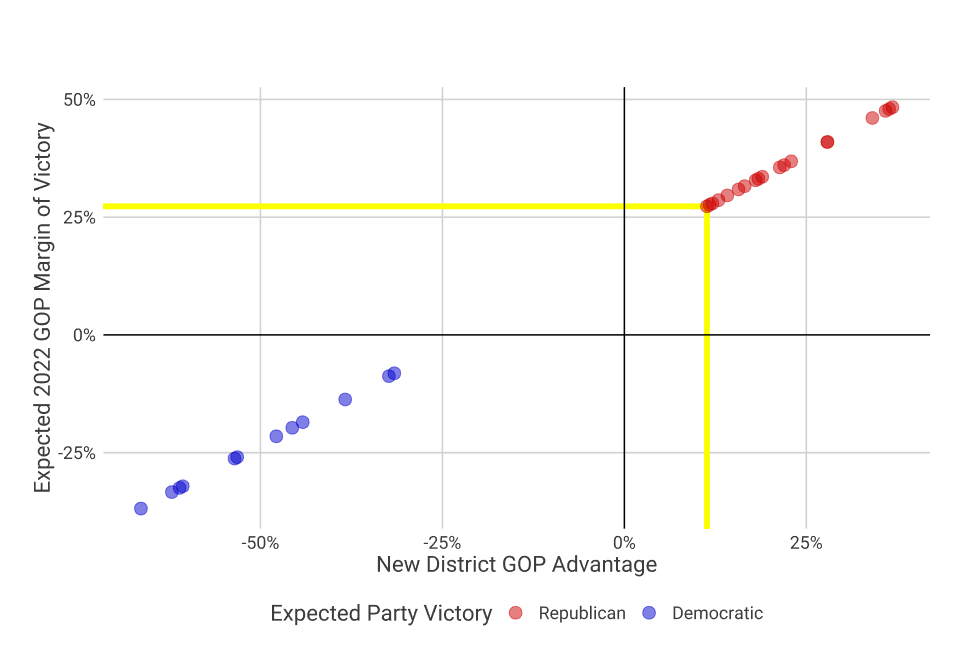
After all, even if her district lines remained the same, her 2018 Blue Wave victory would be hard to replicate in a 2022 election season which many expect to sway heavily Republicans’ favor. In fact, using a regression model based on prior Texas Senate election results, Senator Powell is modeled to lose by a margin of approximately 27% in 2022, assuming that no judicial decision requires her district’s lines to be redrawn. On the chart below, District 10’s prediction data point is at the intersection of the yellow lines. As you can see, while it is certainly one of the more contested Republican-leaning seats, Republicans have a massive advantage nonetheless.
However, Senator Powell is not going down without a fight. Earlier this month, she filed a lawsuit alleging that the new district dilutes minority voters’ electoral power. Let’s examine that claim.


SD-10 Demographic Shifts


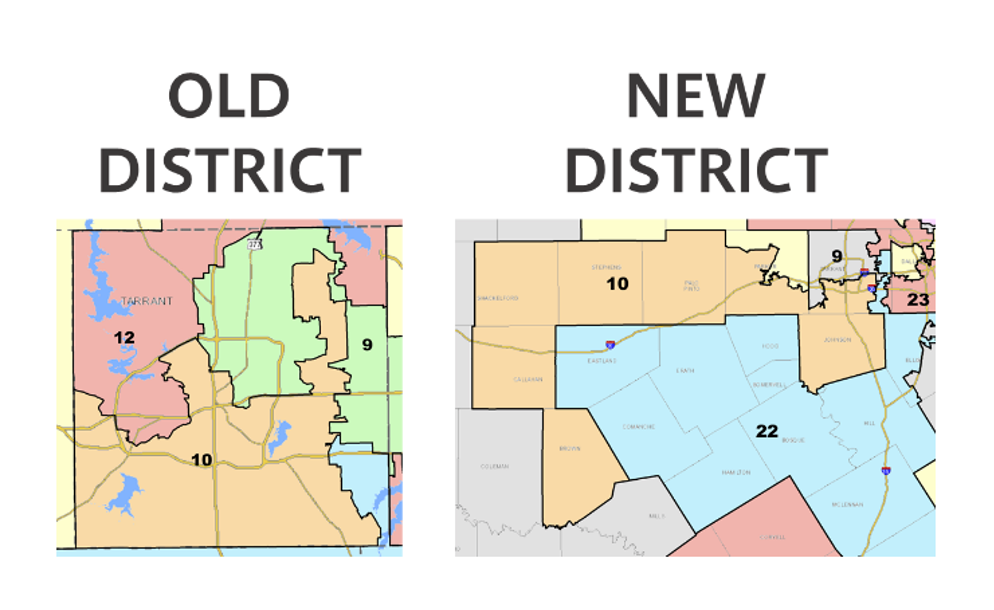
Upon glancing at a comparison of the old SD-10 and the new SD-10 (such as the one shown below), it’s clear that the district underwent significant changes. Formerly only a subsection of Tarrant County, SD-10 now incorporates parts of Tarrant and Parker Counties, as well as the entirety of five other counties. However, this is far from enough evidence to conclude that the district was intentionally constructed to dilute the minority vote.
Perhaps the most straightforward way to examine whether the district dilutes the minority vote is to simply compare the demographics of the old and new districts. The chart below does just that. It’s true that the Hispanic, Black, and Asian votes were each reduced, and that the Anglo vote increased. But once again, is that enough evidence to claim that the minority vote was intentionally diluted? Again, not quite. After all, there are always slight demographic shifts when districts are refurnished to fit changing population dynamics. Additionally, each of the minority demographic groups decreased by a margin of 3.6% or less, which is certainly a believable shift when the district’s lines were so fundamentally changed.
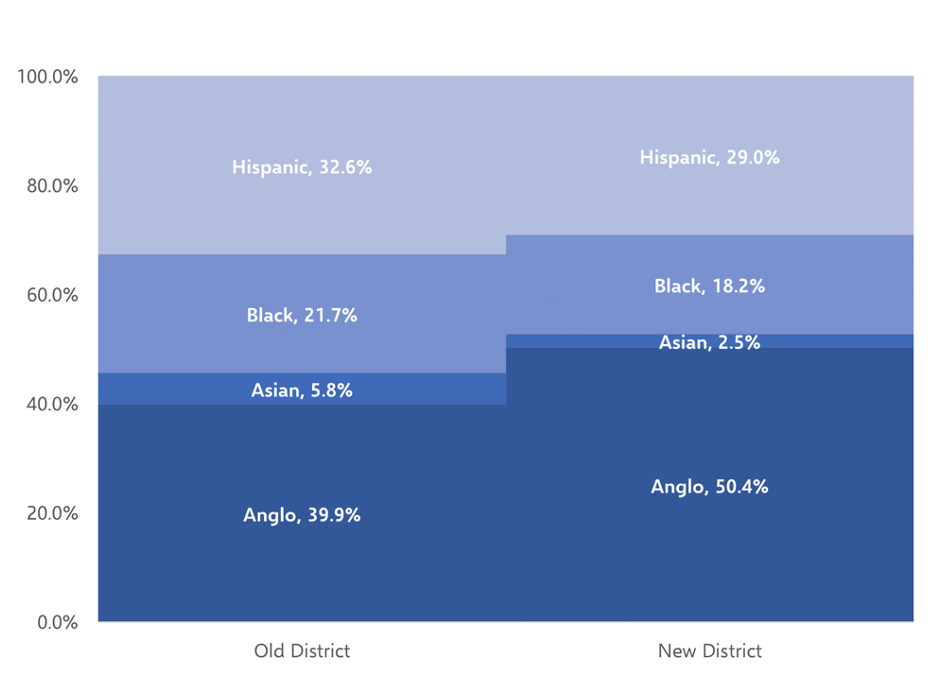
Republicans have fought back against Sen. Powell’s claims that the redistricting process intentionally diluted the voices of voters of color, pointing out that they used a “race-blind” process (a term with a contradictory connotation for some). Regardless, the reality is that the new SD-10 electorate (barely) has an Anglo majority, while the old SD-10 only had an Anglo plurality.


So what’s the verdict?


While that’s a question the Texas judicial system will have to answer in the coming weeks and months, we can still provide an educated opinion with the help of some data. While it is true that the minority vote in SD-10 now has less power than it did before redistricting, minorities in other Democratic-leaning districts gained power as a result of redistricting. All things considered, we find it much more likely that the discrepancies are a result of partisan undercurrents rather than any sort of racial motivation. It’s nearly impossible to ignore politics during the redistricting process, and Sen. Powell was in an extremely vulnerable district to begin with.


This type of thing is bound to happen to someone when all 31 districts are being reshaped. Unfortunately for Sen. Powell, unless the judicial system rules in her favor, it looks like she’ll be the casualty of this decade’s redistricting process.


March 27, 2026
FOR IMMEDIATE RELEASE March 27, 2026 Contact: Victory Insights [email protected] (929) 388-6585 Victory Insights Wins 8 Awards at 2026 Pollies Amelia Island, FL – Last night, the American Association of Political Consultants announced the winners of the 2026 Pollie Awards at their annual conference and awards ceremony. The Pollies recognize exceptional performance and innovations in the political industry and have been dubbed “the Oscars of political advertising” by Esquire Magazine. Victory Insights was well-represented at the event, winning 6 awards directly and participating in 2 other award-winning projects. Most notably, Victory Insights won Gold for “Best Use of Data & Analytics” in both the Campaign Strategy and Fundraising categories. Victory Insights also won Gold for “Best Use of Mobilization Technology,” Silver for “Best Use of Mobile Technology,” and Bronze for “Best Use of AI in Polling” and “Best Use of Phones/SMS.” Victory Insights was also part of the Gold-winning team for the “Best Field/GOTV Series” in the nation. We at Victory Insights are always pushing the envelope of what is possible in the political industry. Our unmatched technologies, service, speed, pricing, and work ethic shine through in everything we do, and we are glad the AAPC has granted us this recognition. We look forward to delivering more innovations and big wins in 2026 and beyond. ###
March 14, 2026
FOR IMMEDIATE RELEASE March 14, 2026 Contact: Victory Insights [email protected] (929) 388-6585 Campaigns & Elections Magazine Names Victory Insights “Most Innovative Startup” Charleston, SC – Last night’s Reed Awards, presented by Campaigns & Election Magazine, recognized the top talents across the political industry. Victory Insights brought home 3 of the most envied awards. First, Victory Insights was named Most Innovative Startup for our launch of the political fundraising and outreach app DonorDex. Then, for the same innovative product launch, we were awarded Best Use of Phones for Fundraising. Finally, we won Best GOTV or Field Campaign for our efforts executing the analytics, outreach, and execution of a massive statewide campaign bus tour. We at Victory Insights are so proud to be named the Most Innovative Startup in the industry and look forward to innovating further. Every award we win is validation that our commitment to relentless innovation is making us the most cutting-edge political firm in the nation. ###
May 23, 2025
FOR IMMEDIATE RELEASE May 23, 2025 Contact: Victory Insights [email protected] (929) 388-6585 Victory Insights Wins 6 Awards at 2025 Pollie Awards Colorado Springs, CO – This week, the political consulting industry gathered in Colorado Springs for the annual Pollie Awards & Conference, hosted by the American Association of Political Consultants. At this event, Victory Insights was honored with 6 awards spanning several product offerings. Most notably, Victory Insights was awarded Gold (1st Place) in the "Best Innovation for Voter Targeting," "Best Use of Polling Research (State)," and "Best Use of Peer to Peer Texting" categories. In addition, Victory Insights was awarded Bronze (3rd Place) in the "Best Use of Polling Research (Ballot Initiative)," "Best Telephone Town Hall," and "Best Use of New Digital Technology" categories. These awards are the result of many years of innovation by the Victory Insights team. Our proprietary technologies, utilized both in our polling and in our campaign services, are the industry standard. We will remain on the cutting edge of the political industry as we continue to work on the most advanced technologies in polling, outreach, and beyond.  ###
March 24, 2025
FOR IMMEDIATE RELEASE March 24, 2025 Contact: Victory Insights [email protected] (929) 388-6585 Victory Insights Wins "Best Innovation in Survey Research" at 2025 Reed Awards Austin, TX – Last week, the political media outlet Campaigns & Elections hosted the 2025 Reed Awards, dubbed "The Political Campaign Industry Event of the Year," in Austin, Texas. At this event, Victory Insights was presented with the "Best Innovation in Survey Research" award. Our firm was honored with this prestigious award in honor of our innovative Poll Dashboard, which has revolutionized the way poll results are presented to clients. Using an interactive dashboard and a conversational AI agent with deep knowledge of the poll results, Poll Dashboard represents the first major rethinking of survey deliverables in the industry's century-long history. Poll Dashboard was rolled out to a select number of clients in 2024 and is already being deployed in a more extensive fashion in 2025. Furthermore, Poll Dashboard is constantly being improved upon, and is only one of many cutting-edge internal tools developed by Victory Insights. We were founded with the promise of spurring innovation in the slow-to-innovate political polling industry, and this award is proof that we're delivering on that promise. ###
July 30, 2024
We expect Michael Way to finish in the top two in the Republican Primary for Arizona’s 15th State House district, thus winning one of the two GOP nominations.
July 22, 2024
The poll numbers showed that Republicans viewed Ron DeSantis more favorably than Donald Trump. The numbers were right, but DeSantis still got crushed. Here’s why.
April 25, 2024
FOR IMMEDIATE RELEASE April 25, 2024 Contact: Victory Insights [email protected] (929) 388-6585 Victory Insights Wins "Best Use of Data Analytics and Machine Learning" at the 2024 Pollie Awards Washington, DC – Last week, the American Association of Political Consultants hosted the 2024 Pollie Awards in Washington, DC. At this event, Victory Insights was awarded 1st place in the "Best Use of Data Analytics and Machine Learning" category. Our firm was honored with this prestigious award as a result of our groundbreaking campaign data management software, called Campaign Dashboard. Throughout the 2023 election cycle, Campaign Dashboard was used in dozens of campaigns to synthesize regular voter data with up-to-date on-the-ground data from polls, web forms, door-to-door campaigning, and more. Additionally, our software provides users with integrated AI chat functionality to pull outreach lists, analyze data, and receive campaign strategy recommendations driven by machine learning. Innovation is at the heart of everything we do. We were founded with the intention of shaking up the political polling industry, and that's exactly what we've done. We look forward to continuing to innovate how data is collected, analyzed, and utilized in the political industry. ###
July 24, 2023
General elections are frequently discussed, but rarely understood. Commentary about general election outcomes often resorts to pointing fingers and saying “I told you so,” instead of focusing on available data and objective facts. We believe that the largest contributing factor to this unfortunate phenomenon is the lack of a data-driven model capable of explaining general election outcomes. For this reason, we’ve developed such a model. This model can be expressed in two different ways: (1) qualitatively in a three-layer model for abstract discussion, and (2) formulaically for precise calculations. Let’s start with the qualitative three-layer model. As shown in the diagram below, the base of this model is Voter Registration, followed by Turnout, and finally topped with Support.
July 24, 2023
In mid-May of this year, Florida politicos on both sides of the aisle turned their attention towards Duval County, where the race for Jacksonville Mayor was coming down to the wire. Despite the fact that Democrats made up 4.3% more of the registered voter base than Republicans in Jacksonville, Republican turnout exceeded Democratic turnout by 3.2% by the end of Election Day. With turnout numbers tilted in their favor, Republicans were hopeful that their nominee, Daniel Davis, would come out victorious. That didn’t happen. Instead, Democrat Donna Deegan won with 52.1% of the vote, besting Davis’s 47.9%. Despite strong Republican turnout – bolstered by the Florida GOP’s get-out-the-vote efforts – the Republican candidate had lost, and many on the right were left scratching their heads and asking, “What went wrong?” In this article, we’ll be answering that question through the lens of the Victory Formula, a model developed by our team for the purpose of understanding general election outcomes. If you’d like to take a deeper dive into this formula, you can read this article explaining how it works. But for our purposes today, all you need to know is that the formula takes in nine variables (three about voter registration, three about turnout, and three about support for each candidate), and produces the exact margin by which a Republican candidate wins (or loses) a head-to-head general election. Since the election in Jacksonville has already happened, we were lucky enough to have exact final numbers for voter registration and turnout, meaning all that’s left for us to understand is the layer we refer to as “support.” This layer has three simple variables: Republican loyalty, Democratic loyalty, and nonpartisan loyalty. Republican loyalty refers to the percentage of Republican turnout that resulted in votes for the Republican candidate. For instance, if 100 Republicans voted in the election, but only 75 of them voted for the Republican candidate, then Republican loyalty would be 75%. Democratic loyalty refers to the same concept, just on the Democratic side. And finally, nonpartisan loyalty simply refers to the percentage of the nonpartisan/third-party that went to the Republican candidate. None of these variables can be found in the election result data. Instead, we must use the Victory Formula to make inferences about their values, and from there, draw conclusions about why the race ended up the way it did. But there’s an issue: with three unknown variables, there are many different combinations that could result in Deegan’s 4.2-point victory. In fact, these potential “solutions” can be mapped out on a three-dimensional surface:
June 29, 2023
Data analysis always helps – even on the School Board It’s not just political polling that benefits from rigorous data analysis. This past week, our firm was tapped to do some impromptu data analysis to check if a Collier County, FL School Board member’s claim was accurate. It turns out, it wasn’t – and we had the receipts to prove it. In November of 2022, Collier County elected an all-new conservative majority to their School Board, and the county’s superintendent “stepped away” from the job not long after. The ensuing process to hire a new superintendent was contentious, but eventually the Board decided on Dr. Leslie Ricciardelli, a longtime Collier County educator, and the next step was to iron out a contract. There were two schools of thought on the matter. One wing of the Board supported Dr. Ricciardelli’s request to be paid $305,000 per year. The other wing wanted to offer a lower salary, as that’s what was advertised in the job posting. At a public School Board meeting, conservative activist Rachael Schaaf questioned whether this $305,000 salary was a responsible use of taxpayer money. In response, School Board member Stephanie Lucarelli – the most outspoken proponent of the salary increase – argued that $305,000 was “in line with other superintendents across the state.” It is this statement that we were tasked with fact-checking. To do so, we collected data on superintendents’ salaries from every county in the state of Florida, as well as each county’s total student enrollment. We plotted this data in the chart below, and with the help of a trusty trendline, we clearly showed that the proposed $305,000 salary was out of line with counties with similar enrollments.
MORE POSTS