THE NATION'S MOST TRUSTED FIRM
Our polls are widely reported and widely respected. Local, national, and global media outlets trust our analyses. Candidates depend on them. We have the nation's trust for a reason: we have an unparalleled track record of success.


OUR POLLS
AZ-5 POLL: MARK LAMB HOLDS MASSIVE LEAD
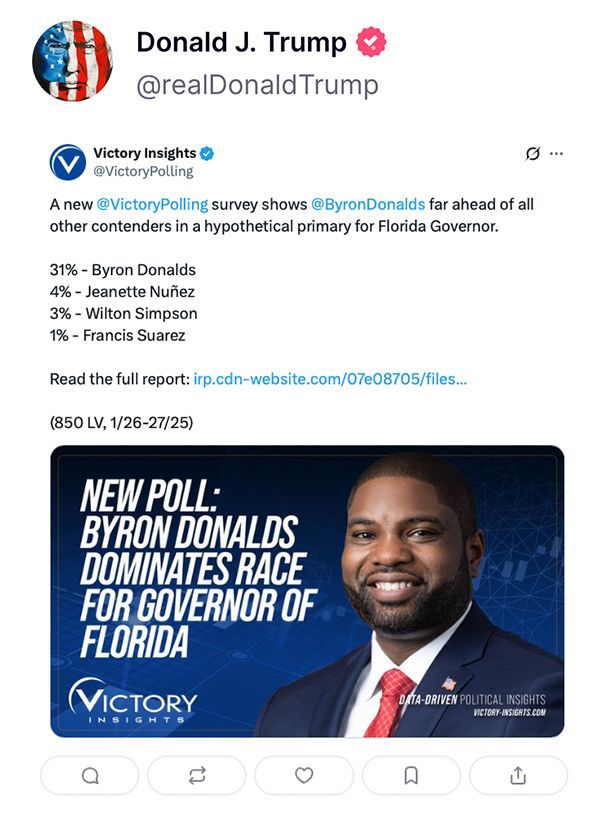
FLORIDA GOVERNOR POLL: BYRON DONALDS DOMINATES
NYC MAYOR POLL: MAMDANI LEADS CUOMO & SLIWA
NC US SENATE POLL: ROY COOPER NARROWLY LEADS MICHAEL WHATLEY
FLORIDA POLL: BYRON DONALDS LEADS DAVID JOLLY FOR GOVERNOR
GET STARTED